When visiting Shrewd'm with a laptop, it can be pleasant to hold Command (or Ctrl with Windows) and '+' a few times. The site scales to allow any font size, and the larger font can be pleasant to read even for Shrewds with perfect sight! For luxury Shrewdness, you can combine that with setting the browser to full screen. You'll then find yourself Shrewding a lot.
- Manlobbi
Halls of Shrewd'm / US Policy
No. of Recommendations: 10
The forward PE of the S&P500 is presently 15 which is a little below its historical average of 17 value since 2000. Refer to figure 2:
https://yardeni.com/charts/sp-600/This contrast with the forward PE of the S&P500 now trading at 22 versus its 25-year average of 16. Refer to figure 9:
https://yardeni.com/charts/sp-500/Perhaps it is better to hold the S&P500, despite being more overvalued (relatives to its own past average multiples) than the S&P600? Well, not so fast, because historically the small caps (and medium caps) grew faster than the large caps looking back over the 20th C.
Even over just the last 25 years, where we have seen dominant tech firms taking much of the market's earnings, small caps still outperformed the large caps in sales per share growth (a good proxy for real growth as the margin changes have upper and lower bounds so the start/end values distort the sense of underlying growth). The small caps grew faster over the last 25 years at a rate of (90/10 - for a CAGR of 9.2%) versus (290/50 - for a CAGR of 7.2%). Refer to figure 5:
https://yardeni.com/charts/largecaps-vs-smidcaps/By holding the S&P600 right now, through an ETF such as 'IJS' or 'IJR', you get a double whammy: (1) You are buying at a forward PE below its 25 year average, (2) the growth has historically been higher than the S&P500.
There is a lot of discussion in the media, YouTubers, and amongst forums, to diversify away from US stocks to international ETFS. However, if you want to hold an ETF that isn't overvalued, just avoid the large cap stocks. IJR (or IJS which I slightly prefer) will do fine (for which the data above matches).
- Manlobbi
No. of Recommendations: 1
The forward PE of the S&P500 is presently 15 which is a little below its historical average of 17 value since 2000. Refer to figure 2:
https://yardeni.com/charts/sp-600/
This contrast with the forward PE of the S&P500 now trading at 22 versus its 25 average of 16. Refer to figure 9:
https://yardeni.com/charts/sp-500/Is that a typo in the first paragraph that should read "of the S&P 600 is presently 15"? Presumably since the link looks to be that. A shame there is no post editing here, yet.
No. of Recommendations: 39
Is that a typo in the first paragraphYes, thanks. I have re-written the post here:
The forward PE of the S&P600 (small caps) is presently 15 which is a little below its historical average of 17 value since 2000. Refer to figure 2:
https://yardeni.com/charts/sp-600/This contrast with the forward PE of the S&P500 (large caps) now trading at 22 versus its 25-year average of 16. Refer to figure 9:
https://yardeni.com/charts/sp-500/But looking at the index quotes, small caps didn't perform as well as large caps the last 25 years. So perhaps it is better to hold the S&P500, despite being more overvalued (relative to their own past average multiples) than the S&P600? Well, not so fast, because historically the small caps (and medium caps, but for now I'm showing the small cap data) grew faster than the large caps looking back over the 20th C.
Even over just the last 25 years, where we have seen dominant tech firms taking much of the market's earnings, small caps still outperformed the large caps in sales per share growth (a good proxy for real growth as the margin changes have upper and lower bounds so the start/end values distort the sense of underlying growth). The small caps grew faster over the last 25 years at a rate of (90/10 - for a CAGR of 9.2%) versus (290/50 - for a CAGR of 7.3%) for the large caps. Much of the S&P500 index gains that you observe is just from the multiple increase, not from sales growth. Refer to figure 5:
https://yardeni.com/charts/largecaps-vs-smidcaps/By holding the S&P600 right now, through an ETF such as 'IJS' or 'IJR', you get a double whammy: (1) You are buying at a forward PE below its 25 year average, (2) the growth has historically been higher than the S&P500 both the last 25 years, and looking further back. (There are reasons to expect this to continue over the long term but that would take a longer post.)
There is a lot of discussion in the media, YouTubers, and amongst forums, to diversify away from US stocks to international ETFS. However, if you want to hold an ETF that isn't overvalued, just avoid the large cap stocks. IJR (or IJS which I slightly prefer) will do fine (for which the data above matches).
That doesn't say anything about how SPY versus IJS will perform the next 3-6 years, but a lot about their relative long-term performance, which is what counts for most true investors.
- Manlobbi
No. of Recommendations: 3
I am a long term holder of VBR which is a close competitor to IJS. As with most Vanguard funds VBR has a lower expense ratio than IJS. Over the last 5 years, VBR has outperformed IJS by about 10%.
No. of Recommendations: 0
No. of Recommendations: 0
Concerning my Small Cap exposure, 50% is in VBR and 50% in SLYV
No. of Recommendations: 8
Be careful to not lose the forest for the trees. It really doesn�t matter which small cap ETF you use. Just pick one.
The forest is to avoid the large caps. Which small cap you chose won�t be huge as they are extremely correlated. You return will be very different to SPY though.
I like IJS as from longer studies pre-1980 back to 1950 with the Compustat database adding a low price to sales requirement gave an improvement particularly with small caps, though the effect was not there the last 25 years with IJR (without the value related filters) having the same performance. I�ll take the longer data range to make my decision, with no discernable disadvantage with IJS.
If you look over 20+ year averages the performance of all VBR, IJS and IJR are practically the same, don�t worry about it between them if you want to match the S&P600 and just pick one as long as you don�t see high fees. 0.18 for IJS, 0.07 for VBR. However though Vanguard call it small cap, VBR is not a true small cap and closer to a mid cap (whilst IJR is exactly the S&P600) (see
https://etfdb.com/tool/etf-comparison/IJS-VBR/#hol... under section 'Market Breakdown') which accounts for VBR's extremely low expense ratio. In the larger picture, all three ETFs have very low fees, the small caps very slightly outperformed mid caps very long-term (though they are amazingly similar) so I would deem it a wash as to which ETF to select and not worry about it.
For the case of AVUV take care though - it run only since late 2019 and AVUV is really interesting as it is an mechanical investing (MI) strategy that filters for low valuation and higher margins. As it did well over just 4 years it on the radar of increasly more people - but that is what happens with all *recently* strong funds and any MI strategy can do well for merely 4 years. The marketing effort pumps up also so we tend to observe the recent well performing as promotion bias. Don�t extrapolate the recent outperformance. There is nowhere near enough data to draw anything from it.
- Manlobbi
No. of Recommendations: 1
SPAM is also S&P 600 and cheaper.
IJS in concentrated in financials far more than IJR. 27% to 20%.
What's a forest? I am just a little ant that likes the VB tree the most 😀
No. of Recommendations: 1
Excellent posts, Manlobbi. By any chance, do you (or anyone else reading this note) have a sense of the mean historical Shiller CAPE as well as the current Shiller CAPE for the S&P 600?
It seems to me that that comparison could provide a more in-depth understanding of the historic vs. current valuation.
No. of Recommendations: 6
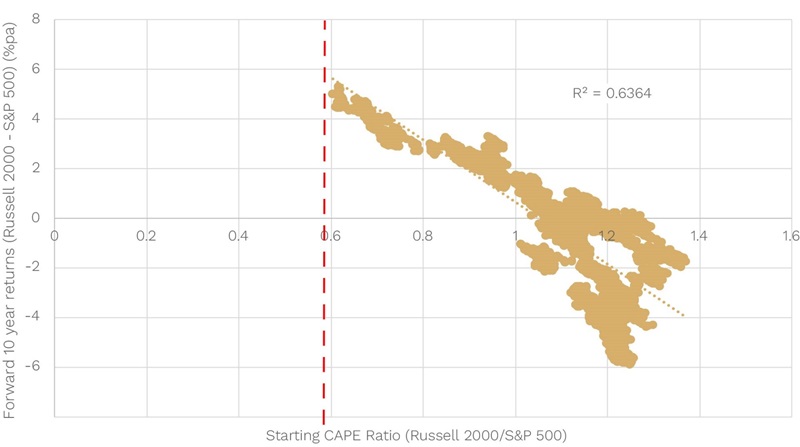
By any chance, do you (or anyone else reading this note) have a sense of the mean historical Shiller CAPE as well as the current Shiller CAPE for the S&P 600?The following chart is even better. Where we are today as at the vertical red line:
https://www.firstlinks.com.au/uploads/2024/am-fig4...It shows the differences in valuations (using CAPE) between US small caps (Russell 2000*) and large caps and their subsequent 10-year relative returns.
This relationship is even better than looking at the individual CAPE charts, as the ratio explains 64% of the subsequent return difference - as you can see by the scatterplot so close to a line.
Today the Russell 2000 CAPE ratio is 19x versus 32x for the S&P500, the lowest/cheapest since 2000.
In thr past, when small caps have been this cheap versus large caps, they have gone on to outperform by 5% over the next decade.
* The S&P600 is more or less the same as the Russel 2000 but the S&P600 has the profitability requirent filter and over the long term outperformed, but they are highly overlapped and analysis upon one is very good as a proxy for analysis upon the other - especially when comparing to the S&P500 which is radically different.
- Manlobbi
No. of Recommendations: 2
Hi Manlobbi,
I cannot overstate my appreciation for your tireless efforts and invaluable contributions to this board. Your dedication to single-handedly developing and maintaining this platform has created an exceptional resource for investors. Your insights have significantly enhanced my understanding of small cap vs. large cap valuations and expected performance.
However, I respectfully offer a different perspective on the utility of the chart you shared compared to absolute Shiller CAPE values.
Consider a hypothetical scenario where the S&P 500 yields 0% per annum over the next decade. The relative performance chart suggests the Russell 2000 might yield around 5% per annum in this case. However, this return alone wouldn't be sufficient to justify an investment in the Russell 2000 for my risk tolerance.
Conversely, if the mean historical Shiller CAPE and the current Shiller CAPE for the Russell 2000 are comparable (or if the historical mean exceeds the current value), I'd find that a lot more compelling. Such a scenario would suggest the potential for returns closer to the Russell 2000's historical performance (which I estimate to be around 10%, give or take).
Thank you again for fostering such an enlightening environment for investment discussion and analysis.
No. of Recommendations: 7
Thank you for the kind words. It was incredible that much of the 20+ year community was about to evaporate prior to Shrewd�m. I didn�t think twice and got to work reflexively. I�m grateful to Oscar255414 and others that have helped.
Consider a hypothetical scenario where the S&P 500 yields 0% per annum over the next decade.Sure, but I presented the ratio of the large cap CAPE to small cap CAPE because the correlation with their relative future returns, is a profoundly strong correlation - even stronger than the individual CAPE predictive power.
To see the S&P600 CAPE ratio separately, along with its historical values:
https://substackcdn.com/image/fetch/f_auto,q_auto:...For the S&P600 CAPE it stands today at a lowish value that was only lower 10% of the time back to 2000 (during the 2009 recession) and was lower 40% of the time looking back to 1983.
In a nutshell the S&P600 is moderately undervalued so you can expect an
above �average S&P600 10-year� return from here, noting that the �average S&P600 10-year return� itself is already around 2% higher than what you will expect on average for the S&P500
even if they had the same relative valuation owing to small caps growing faster than large caps over time.
Small caps got a total return of about 8% above inflation long-term, thus around 8% if bought at an average CAPE level in the past.
You can also study the current margins of the large caps and small caps relative to their individual own historical margins also. The large cap margins are really high right now compared to their historical average level, and the small cap margins around their own average historical level.
- Manlobbi
No. of Recommendations: 1
Hi Manlobbi,
Excellent! The chart of absolute Shiller CAPE values is invaluable. Thank you again!
No. of Recommendations: 1
I like IJS as from longer studies pre-1980 back to 1950 with the Compustat database adding an earnings requirement gave an improvement particularly with small caps, though the effect was not there the last 25 years with IJR (without the filter added for positive earnings) having the same performance. I�ll take the longer data range to make my decision, with no discernable disadvantage with IJS.IJS iShares S&P Small-Cap 600 Value
https://www.ishares.com/us/products/239775/ishares...IJR iShares Core S&P Small-Cap ETF
https://www.ishares.com/us/products/239774/?referr...Vanguard has an IJS equivalent that's a little cheaper:
VIOV Vanguard S&P Small-Cap 600 Value
https://investor.vanguard.com/investment-products/...Isn't IJS the value slice of the S&P600? Also known as a style index. IJR holds all the stocks in IJS, plus the "growth" stocks in the index.
https://www.spglobal.com/spdji/en/documents/method...They take the S&P600 index and split it into "growth" and "value" components, with overlap. Value is measured by low price to book.
For the case of AVUV take care though - it run only since late 2019 and AVUV is really interesting as it is an mechanical investing (MI) strategy that filters for low valuation and higher margins. As it did well over just 4 years it on the radar of increasly more people - but that is what happens with all *recently* strong funds and any MI strategy can do well for merely 4 years. The marketing effort pumps up also so we tend to observe the recent well performing as promotion bias. Don�t extrapolate the recent outperformance. There is nowhere near enough data to draw anything from it.Sure. The Avantis methodology is more attractive to many investors over the style indices.
Note that AVUV is a very diversified mechanical strategy, holding 735 stocks (IJS holds 479).
No. of Recommendations: 1
the main observation is that you find that the IJR and IJS (S&P600) are extremely correlated (over multi year periods) and there is nothing between them over a long stretch of time, one might do better one decade; the other slightly better another decade Easily taken care of by buying both, in equal amounts.
but both very different to the large cap indexes such as S&P500.Indeed.
Backtest:
https://testfol.io/?d=eJy1jzFPw0AMhf%2BL5xvCUIbMiB...Results (2000-07-28 - 2024-10-01)
Name CAGR Volatility Sortino
IJR 9.61% 23.21% 0.46
IJS 9.48% 23.94% 0.44
50/50 9.54% 23.43% 0.45
SPY 7.86% 19.28% 0.43
No. of Recommendations: 1
I like SLYV
Results (2000-07-28 - 2024-10-01)
Name CAGR Volatility Sortino
SLYV 10.05% 23.08% 0.49
No. of Recommendations: 0
Results (2000-07-28 - 2024-10-01)
Name CAGR Volatility Sortino
SLYV 10.05% 23.08% 0.49
Good catch. Thanks.
Looks like in the S&P small caps, Value beats the snot out of Growth.
One thing to notice is the Drawdowns. MaxDD about -60%. Yikes!
No. of Recommendations: 1
Yeah, about that SLYV timing idea.....
Running a backtest with my favorite timing strategy,
The CAGR dropped from 10.2% to 9.5%
But the stdev (volatility) dropped from 23.0% to 17.8%
And the MaxDD dropped from -55% to -28%.
No. of Recommendations: 0
IJS, SLYV and VIOV all follow the S&P SmallCap 600� Value Index.
https://stockcharts.com/freecharts/perf.php?IJS,SL...Nothing to choose between them, performance-wise. IJS is 3 bips more expensive.
https://www.ssga.com/us/en/intermediary/etfs/spdr-...The S&P SmallCap 600� Value Index measures the performance of the small-capitalization value segment in the U.S. equity market. The Index consists of those stocks in the S&P Small Cap 600� Index exhibiting the strongest value characteristics based on: (i) book value to price ratio; (ii) earnings to price ratio; and (iii) sales to price ratio. The Index is float-adjusted market capitalization weighted.IJR, and ilk, follow the S&P Small Cap 600� Index.
No. of Recommendations: 4
>IJS, SLYV and VIOV all follow the S&P SmallCap 600 Value Index.
Thanks AdrianC, you are absolutely right there and I stand corrected. IJR already has the positive earnings requirement (which is the same as what as S&P600 has, and even the S&P500) so IJR is really trying to map the ordinary S&P600. The IJS ETF has extra value criteria price/book and price/sales added on top. It is just remarkable how similar the performance of IJS and IJR are over the long-term.
S&P Global did create the "S&P600 Small Cap Value" index, distinct from "S&P600 Small Cap", however they don't make it clear at all how the value criteria is selected. I don't think it does much though for the long-term performance either positive or negative.
With value stocks somewhat out of favour today (and IJS having temporarily trailed IJR a little), though, perhaps IJS (expense ratio 0.18%) will slightly outperform IRJ (expense ratio 0.06%) for the next decade. However I do like the low expense ratio of IJR so I don't have an opinion as to which is better - there's nothing in it.
Comparing the different value ETFs options however should not get us away from the larger picture of whether the S&P600 will outperform the S&P500, which was the main subject in the thread. The data is very strongly supporting S&P600 outperforming S&P500, with a central expectation of 5% outperformance over the next decade - fairly unprecedented.
- Manlobbi
No. of Recommendations: 0
The data is very strongly supporting S&P600 outperforming S&P500,This is basically in conformance with what Jim (mungofitch) and others have been saying, that things like S&P500 and BRK will have much lower than typical returns over the next handful of years.
I don't see any significant dfference between IJR, IJS, VBR, SLYV, so I don't think it matters which one (or ones) you invest in.
Very Large Cap growth has been shooting the lights out in recent history. That will change someday. Hard to say how far away that someday is.
I've been buying SLYV primarily for diversification, for the day when the Manificent Dozen quit.
VBR has lower E/R and slightly higher backtest returns than SLYV, but has 20 years of history vs. 24.
Interesting that
https://www.etfrc.com/funds/overlap.php says there is only 17% overlap in their holdings.
Also interesting that just the plain S&P600 index (IJR) has almost the same return as the Value ETF.
No. of Recommendations: 2
Excellent discussion about smaller cap index funds. I've held VBR for several years and am adding VIOV.
I'll add mostly on weakness "as time goes by".
No. of Recommendations: 1
What a marvelously useful insight. I'll be investing accordingly. Of course, it's too much to hope for an equal-weighted S&P 600 index, isn't it?
Warmly,
Wot
No. of Recommendations: 7
What a marvelously useful insight. I'll be investing accordingly. Of course, it's too much to hope for an equal-weighted S&P 600 index, isn't it?To cut to the chase, there would be no discernable difference between an equal-weight small cap and the ordinary small cap index. If you, similarly, chart an a small cap index (such as IJR) and an equal weight S&P500 index (such as RSP) together over many decades, then you will find their performance is incredibly correlated (other than the last 3 years in which small caps are particularly out of favour right now, though they will mean revert as just trading at low earnings multiples today - this is an argument to move
in to rather than
out from small caps right now).
The corollary is that when you moved from the S&P500 (SPY) to an equal-weight S&P500 (RSP), nearly all of the outperformance you receive with the equal-weight index isn't from the equal weight concept itself, but rather from the fact that the large caps are being profoundly de-emphasized (such much so, that the effect is close to removing the largest 5% of the holdings completely from the index).
Those statements above apply at any random time in the past history when considering long-term returns from that average starting point. However, right now is not an average starting point - the situation is more extreme as this chart shows:
https://www.firstlinks.com.au/uploads/2024/am-fig4...Within this diagram, on average in the past, the red line was
by definition in the middle of the cluster. Because it is extremely far to the left, it will deviate back to the middle of the cluster at
some point in time. Even if it takes 10 years to move to the centre of the cluster,
you will receive an S&P500 market outperformance of 5% whilst waiting. If it returns faster than 10-years, then your annual outperformance will be more than 5%.
So it was always a good idea to hold an S&P600 (or even an Russell 2000 index - basically any index that simply avoids the large caps, it frankly doesn't matter which one) instead of the S&P500, but
it is an especially good time to hold such a small (or anyway non-large-cap) index right now.
- Manlobbi
No. of Recommendations: 1
Thank you, Manlobbi, for your thoughtful and enlightening reply. I find this whole concept invaluable.
Warmly,
Wot
No. of Recommendations: 1
Which of the largest SP500 stocks do you NOT want to own for the next 10 years?
I own 6 of the top 7 and the one I don't own is Warren Buffett's top holding (AAPL).
Tesla MIGHT be the only one I wouldn't be OK holding that is in the top 20. Add Coke in the top 30.
Appreciate your insights for sure and I don't necessarily disagree but those top 10 I might want to hold on to.
No. of Recommendations: 2
Of the top 10, I omitted AAPL and TSLA.
No. of Recommendations: 2
Validity of forward earnings estimates:
Does anyone know if the validity of the forward earnings estimates has been validated using historical data?
If forward earnings estimates aren't very accurate then looking at values of P/Eforward may not be very informative.
To validate using historical data, one could plot the actual earnings at a point in time along with the forward estimate of earnings for that point in time. Could quantitate level of agreement as well of course.
Perhaps the Yardeni folks have done this, but I'm not very familiar with their voluminous data.
Separate topic:
I love the difference idea. Idle speculation: maybe it's subtracting out some in-common noise. Anyway, it makes one want to go on a differencing hunt.
Echoing others, many thanks for all the work you've put into this wonderful forum Manlobbi!
No. of Recommendations: 2
If forward earnings estimates aren't very accurate then looking at values of P/Eforward may not be very informative.
If you look about halfway down the page on the link below, you will see how forward estimates change over time.
https://realinvestmentadvice.com/q3-earnings-estim...Aussi
No. of Recommendations: 2
@Aussi, thanks much!
Hmmm... interesting graph. What I see is:
The little blue squiggles are analyst's estimates of future TTM earnings, but starting 24 month out.
These blue estimates apparently start in February of each year, then over the subsequent two years are revised until you hit the 24 month out target date.
If above is correct (may not be), then the convergence of the blue squiggles to the red line indicates that the estimates get more accurate as you forecast closer and closer to the earnings date.
That's fine, but I'd have simply plotted what you're predicting at a fixed time out against what occurred at that time, and quantified the agreement with correlation or some appropriate metric.
FWIW, my impression so far is that forward earnings estimates are typically too high.
Doesn't matter much for more extreme values of P/Eforward.
But those pretty Yardeni P/Eforward curves do have error bars, that aren't shown.
No. of Recommendations: 4
No. of Recommendations: 4
Great thread with excellent charts documenting the current value advantages to small cap value at this time compared to large cap.
I've long been a fan of small cap value, and for years Vanguard's small cap value fund (or the VBR ETF, lately) was my vehicle of choice. More recently I noticed that Dimensional Funds Small Cap Value fund created an ETF (DFSV) and have adopted it for my small cap value, since I long admired their offerings but was unwilling to pay the fees to join their mutual fund.
Dimensional Funds Advisors was founded to apply the research of Fama and French to actual mutual funds.
DFSV is not an index but they rigorously follow the small cap value space, and its average holding is smaller and more valuey than the indexes. It has an acceptably low expense ratio of .31%, IMO, as I'll willingly pay the extra .24% for the significant increase in exposure to the small and value aspects of the fund portfolio.
No. of Recommendations: 6
The relative valuations of these sectors continues to greatly favor small cap over large cap.
Scroll down to find chart of the small cap S&P 600 and large cap S&P 500 forward PEs, links originally provided by Manlobbi upthread:
https://yardeni.com/charts/sp-600/https://yardeni.com/charts/sp-500/I'm a fan of small-cap value and while I don't have readily accessible charts to show it, I'm sure it benefits from the same relative valuation advantage as small cap in general, possibly more so.
When stock market volatility increases, small cap, and small cap value often have outsized moves compared to large cap. I.e. right now the S&P 500 is down 1.4% compared to Vanguard Small Cap Value ETF (VBR) down 2.2%.
So, we're at a spot where relative valuations greatly favor small cap, absolute valuations are a bit below the long term average, and volatility is picking up.
If this correction turns into a bear market, it will be an excellent time to buy small cap/small cap value, IMO.
No. of Recommendations: 4
Hey Manlobbi,
In a post some time ago, you provided this link to a graph of S&P 600 CAPE:
https://substackcdn.com/image/fetch/f_auto,q_auto:...I think that is a static image which is increasingly out of date.
Do you know of any publicly available site that posts the S&P 600 CAPE on a regular basis? I've not been able to find one with a bit of searching and hoped you have one in your pocket.
Thanks!
Ben
No. of Recommendations: 4
Over in METAR, Odzar posted about this site:
https://interactive.researchaffiliates.com/ which appears to offer a nice collection of data and analysis, not precisely the US small cap valuation info I was asking Manlobbi about, but something in the ballpark.
Here's Odzar's post:
https://www.shrewdm.com/MB?pid=774250801Copied here for your convenience:
"
Research Affiliates has a very nice free tool (with registration; they haven't spammed me much so far) that estimates expected returns for various asset classes. Lots of cool data, such as CAPE ratios for individual countries. As of 2/28/25 they estimate 0.9% real annualized 10-year return for US large cap stocks, and 5.0% for US small caps. We're down maybe 5% from then, so add about half a percent to those numbers. No S&P 500 cap-weighted index for me yet, thanks.
https://interactive.researchaffiliates.com/"
I don't know anything about the site, the publishers, or how reliable their data and analysis is, but I did sign up and at first glance it looks impressive, though it does not seem to offer the quite the granularity I'd love to see, it's enough to be useful, if we can trust the data/analysis. It does confirm the gross overvaluation of US large cap, duh, and solid expected returns from US small cap of 5% real.
