No. of Recommendations: 6
rayvt prefers 25th percentile CAGR cycle, maximum drawdown, Sortino Ratio, and Standard Deviation. I use average CAGR cycle, GSD, and LDDD3. Actually, I run the stats with 3 different cycles. The minimum CAGR, the 25th percentile, and the median. Three time periods, 1985-2026, 1986-2006, and 2006-2026. That's too much information to post. Pretty much too much information for me to get a handle on, too.
Originally I just looked at the worst CAGR, but that was too pessimistic. Settled on focusing on the 25th %ile, because 3/4 of the cycles are is better than that and only 1/4 of are worse. Better to have good surprise than bad surprise. (Actually, the worst cycle still isn't all that bad. In terms of CAGR, that is. Massive drawdown, though.)
Stdev is an interesting statistic, it is the dispersion of the CAGRs. Per Faber & others, the CAGR is almost always smaller than the STDEV, and if it is suspect if the CAGR is larger. I glance as it as a sanity check. It means nothing.
Drawdowns are the killer. That's where people start jumping out of windows and wifes leaving with the kids.
IIRC, it was Elan who mentioned that the alltime MaxDD could be overly pessimistic, since it is a one-time measure of the worst that has even happened and doesn't reflect the typical happenings. I look at the rolling YOY drawdowns, largely because we tend to focus on one-year happenings.
Sortino Ratio corrects the Sharpe Ratio flaw by looking only at downside deviation and ignoring (the good) upside deviation.
"measure how well an investment pays you back for the bad risk it takes. It looks at your profit while ignoring good upward jumps and counting only harmful downward"A longer backtest is needed to evaluate these types of timing systems that are trying to detect rare events. 20 years is not long enough. We can't chop up the time series or use rolling returns to evaluate these timing systems, because we don't have enough data. Some other method is needed to avoid overfitting.Yes, Claude AI complained about this, too. It went on and on about how pre-2000 was an extraordinary time for Nasdaq 100 growth and also large spreads and market makers playing games at the expense of the public. I still recall the day when I bought a stock in the morning for 30 and it closed at 50. Good times, good times.
Clearly, you cannot look at the 1985-2000 period and pretend that the market will always look like that. What works best then is _very_ unlikely to work that well in more normal times.
Thing is, that's all the data we have. It only starts in 1985.
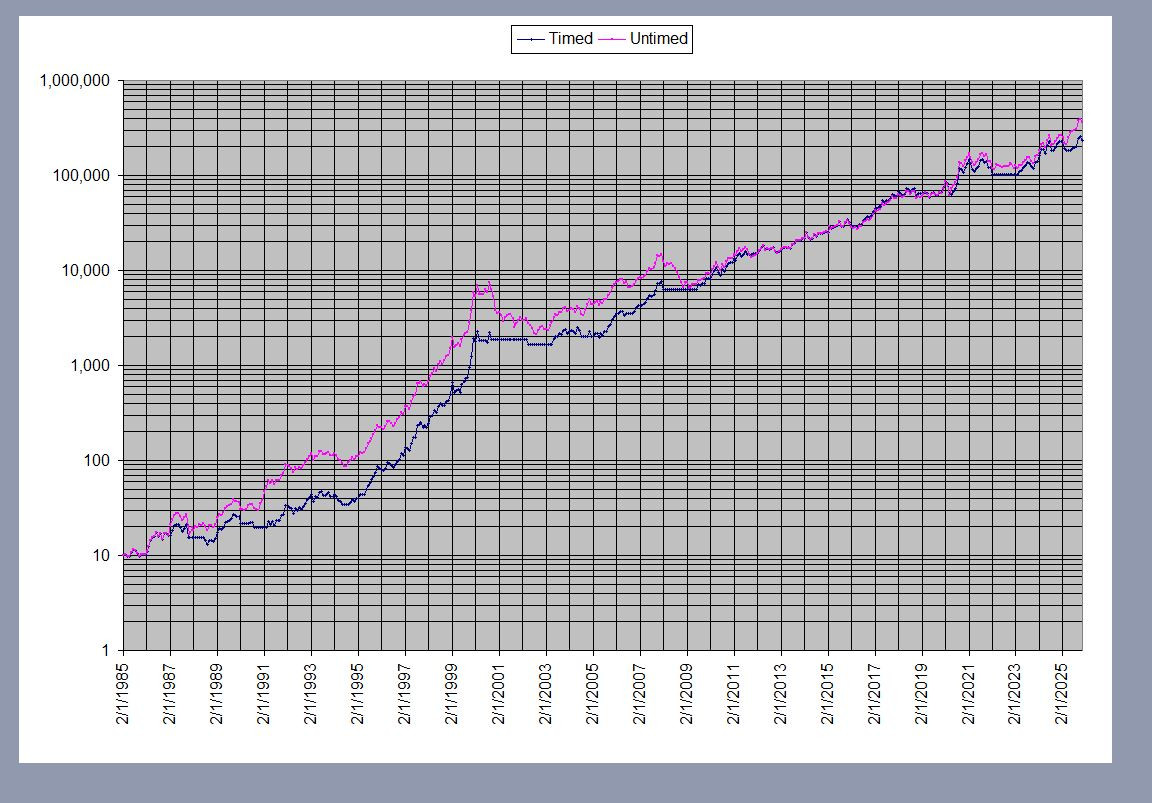
For the purpose of backtesting things, we should really break it into three periods and look for something that works ok in all three.
1985-2000 -- the boom.
2000-2009 -- the bust and ups & downs going nowhere.
2009-now -- the present times.
In the first, timing did worse.
In the 2nd, timing did slightly better.
In the 3rd, timing had essentially no effect.
Ok, let's try the new feature that Manlobbi mentioned, hovering over a picture. The graph, median cycle, 52 week SMA.
i.postimg.cc - Backtest with timing